Locations Overview
In this section we will explore data that will examine where exactly crimes are being committed in LA! The data reveals a diverse story of areas with high crime and others with low crime.
Density of Crime in Different LA Regions
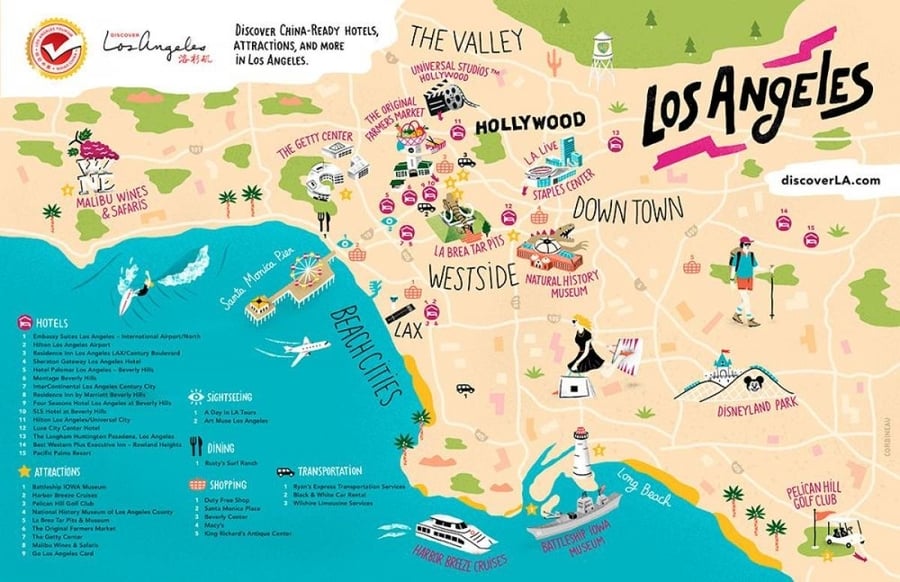
The opaque nature of our graph reveals the "hotspots" crime around the city. This information is a powerful tool for law enforcement to be able to concentrate their resources in regions like Newton, Central, and Southwest LA. While this graph seems like it is failing to illuminate crime across the greater LA region, especially in the south, this is an illusion because this is the shape of the city of LA. There is not a lot of crime reported in the direct vicinity of both airports; however, this may be an indication of the high density of roads/air traffic in that region. Finally, we see there are far less reported crimes in wealthy regions like Beverly Hills.
The average amount of crimes are similar across various LA areas besides a few outliers like Central LA and Foothill. The disparity in household income between Central LA and Foothill is significant. In Central LA the median household income was around $64,000 in 2022. In 2022 in Foothill Ranch the median household income was around $160,000. This disparity in household income seems to be correlated with crime.